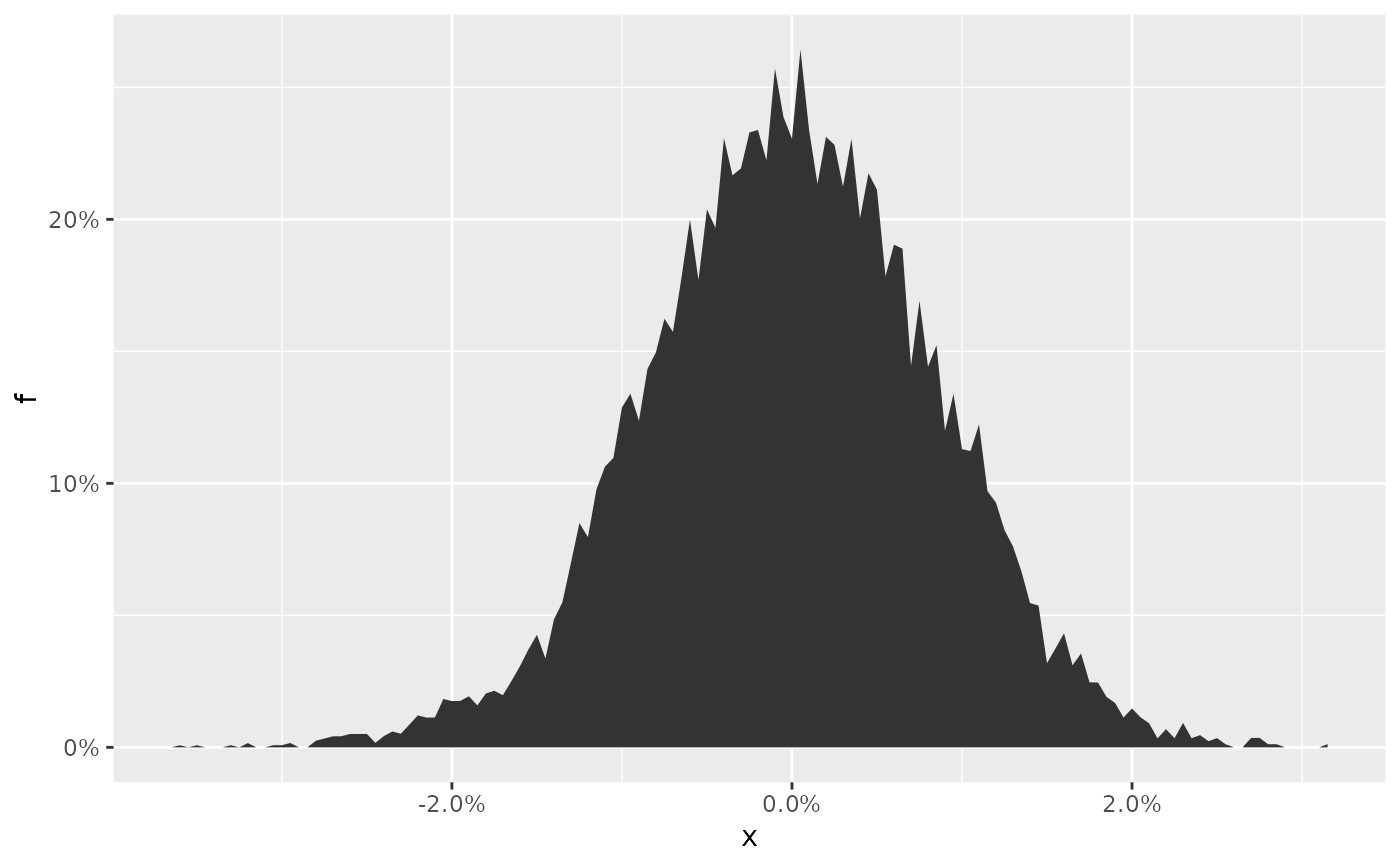
Visualize a Panic Distribution
plot_panic_distribution.RdVisual display of a panic distribution.
plot_panic_distribution(pnl, p = NULL, breaks = 200)
Arguments
| pnl | An univariate time series with the PnL marginal distribution. |
|---|---|
| p | A |
| breaks | An |
Value
A ggplot2 object.
Examples
x <- diff(log(EuStockMarkets))
x <- panic_copula(x = x, n = 10000, panic_prob = 0.02)
w <- rep(0.25, 4)
pnl <- as.matrix(x$simulation) %*% w
plot_panic_distribution(pnl = pnl, p = x$p)